If you are new to the Pico, and Python development, check out Raspberry Pi’s guide to get you started
Kitronik have also written a First Steps Tutorial to get you started using the Pico with the Thonny Editor.
Getting the Smart Air Quality Code
Kitronik have written a module to use with the Pico Smart Air Quality Board which is available, along with sample programs, in the Kitronik GitHub.
If the words “Clone the repo” mean nothing then check out our guide to git
If you are new to using modules with the Pico, there is a helpful guide providing practical examples and explanations on how to do so.
Clone or download the repository and then copy / save the PicoAirQuality.py file to your Pico.
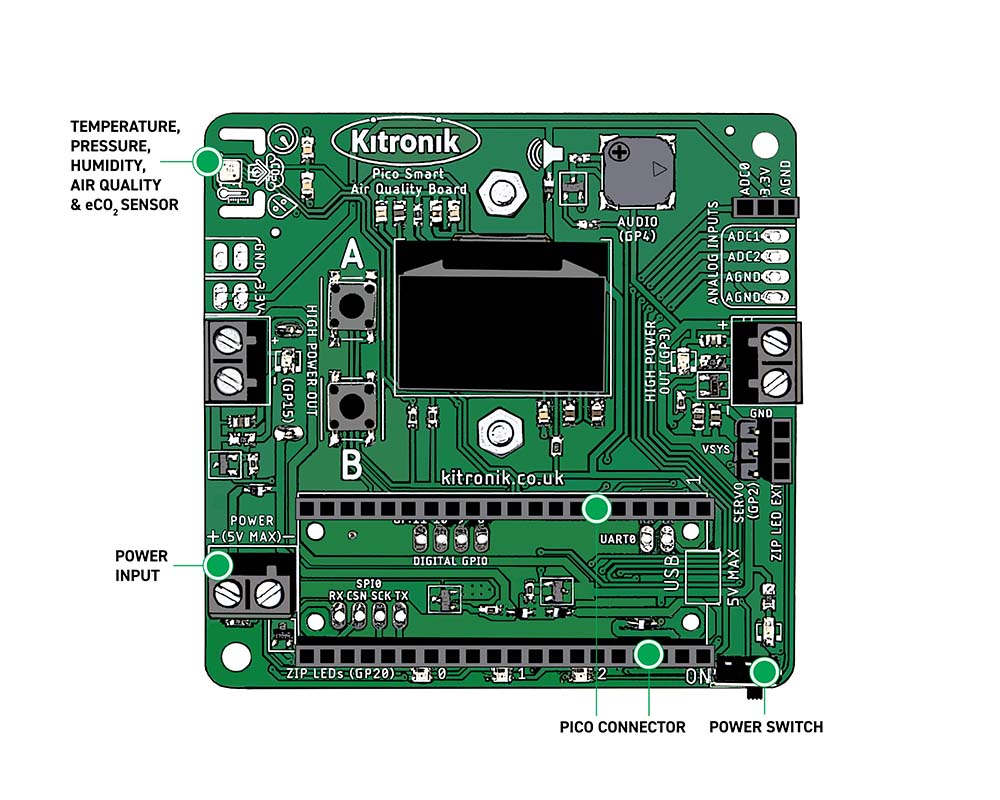
BME688 Sensor
The BME688 sensor provides the main functionality of the board: measuring air quality and climate data which the Pico can then access and read. There are five values which can be measured and read:
- Temperature (in °C or °F)
- Pressure (in Pa or mBar)
- Humidity (in %)
- Index of Air Quality, IAQ (relative value)
- Estimated CO2, eCO2 (in ppm)
This tutorial will take you through setting up the sensor and then accessing the measurements it is capable of taking.
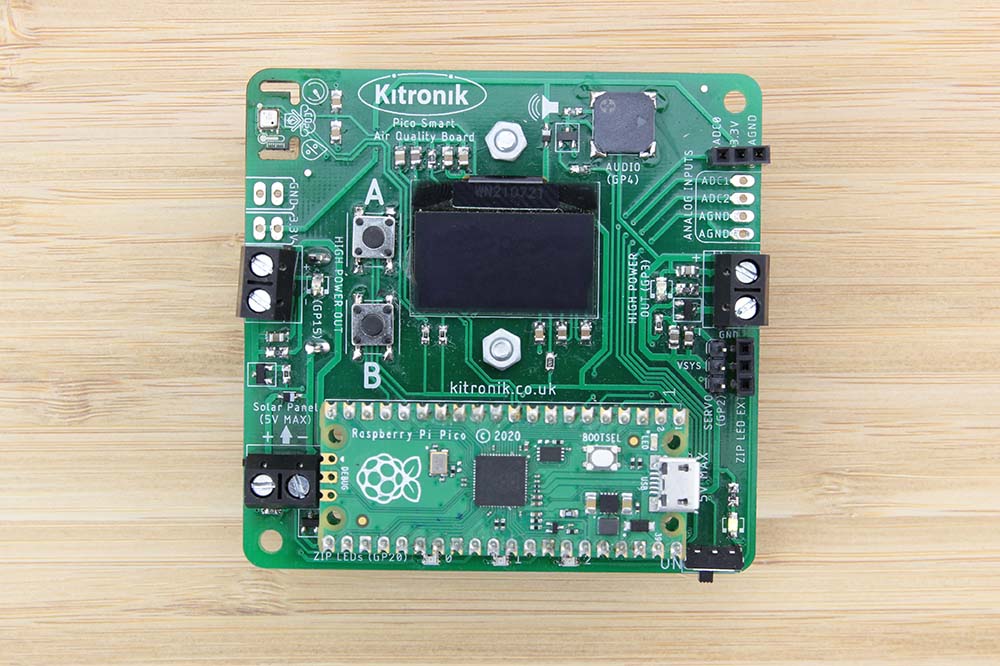
Ensure that your Pico is correctly mounted on the Smart Air Quality Board and switch it on.
Connect the Pico to Thonny by plugging the Pico in with a USB lead, and then, in the bottom right corner of the Thonny window, click and select ‘MicroPython (Raspberry Pi Pico)’.
In Thonny create the following code:
from PicoAirQuality import KitronikBME688
from time import sleep_ms
bme688 = KitronikBME688()
bme688.setupGasSensor()
bme688.calcBaselines()
This imports the BME688 class from the PicoAirQuality module and then creates an instance of the class. At this point, the temperature, pressure and humidity sensors would work straight away, but the gas sensor – which is what provides IAQ and eCO2 readings – needs some extra setup. The ‘setupGasSensor()’ function sets a target temperature for the gas sensor plate and the length of time it needs to be on. In this case, these values are defaulted to 300°C and 150ms which gives a good setup for most general measurements. The gas sensor does not directly output IAQ and eCO2 readings, instead, these values are calculated based on the gas resistance measurement and are then compensated for temperature and humidity variation. In order to provide accurate readings, a calibration stage needs to take place each time the board is placed in a new environment. This is what the ‘calcBaselines()’ function does, carrying out gas resistance and temperature readings over a five minute period, and then calculating the mean values which provide the baselines for future calculations.
The baseline gas resistance and temperature readings are stored in a small file on the Pico (‘baselines.txt’). Once the values are stored in the file, future calls of the ‘calcBaselines()’ function will check whether the file exists and will then default to using the values stored there – this saves time when developing the software. If it is necessary to measure the baseline readings again (i.e. the board location has changed), then either delete the baselines.txt file on the Pico, or call the function passing in True, like this:
bme688.calcBaselines(True) Once the baseline process is complete, all functionality of the BME688 sensor will be available.
Create the following code in Thonny, then save it to your Pico and run the program:
from PicoAirQuality import KitronikBME688, KitronikOLED
from time import sleep_ms
bme688 = KitronikBME688()
oled = KitronikOLED()
bme688.setupGasSensor()
bme688.calcBaselines()
while True:
    bme688.measureData()
    oled.clear()
    oled.displayText("Temp: " + str(bme688.readTemperature()) + " C", 1)
    oled.displayText("Pres: " + str(bme688.readPressure()) + " Pa", 2)
    oled.displayText("Hum: " + str(bme688.readHumidity()) + " %", 3)
    oled.displayText("IAQ: " + str(bme688.getAirQualityScore()), 4)
    oled.displayText("eCO2: " + str(bme688.readeCO2()) + " ppm", 5)
    oled.show()
    print("Temperature: " + str(bme688.readTemperature()) + " C")
    print("Pressure: " + str(bme688.readPressure()) + " Pa")
    print("Humidity: " + str(bme688.readHumidity()) + " %")
    print("IAQ: " + str(bme688.getAirQualityScore()))
    print("eCO2: " + str(bme688.readeCO2()) + " ppm")
    sleep_ms(2500)
If you have not already set a baseline then you should see the words “Setting Baseline” appear on the board’s OLED display screen, along with a progress percentage counter. This process will last for about five minutes and then “Setup Complete!” will appear. Once this process has finished, the different air quality and climate readings should be displaying in the Thonny Shell and on the board’s OLED screen every 2.5 seconds (a full explanation of how to use the OLED screen is given in the OLED and RTC Tutorial).

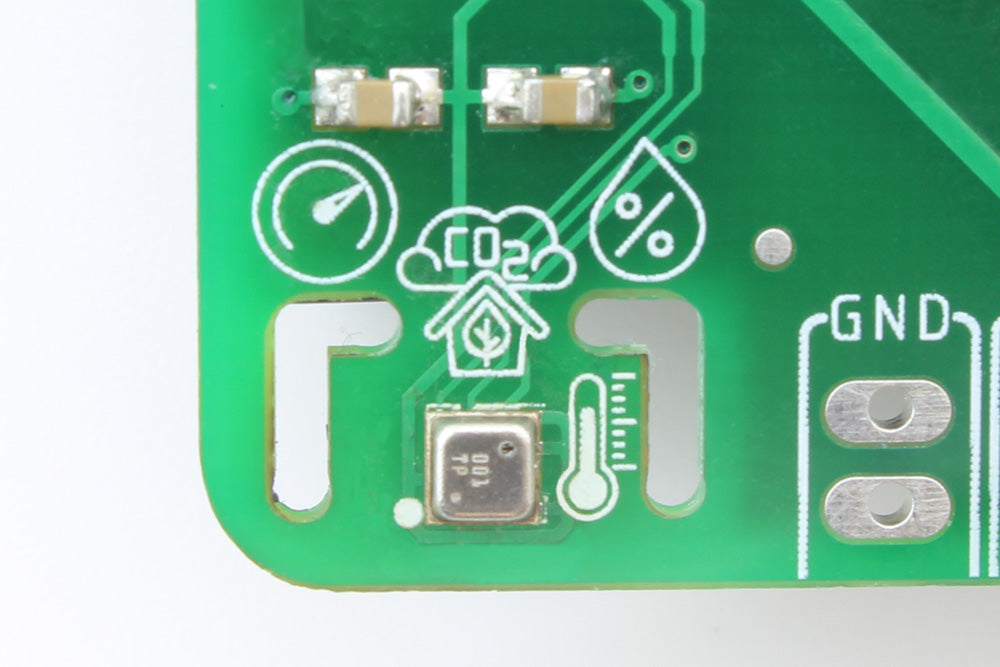
To change the readings, try breathing on the BME688 sensor on the board (top left corner when the Pico is at the bottom edge). This should increase the temperature, the humidity and the CO2 in the atmosphere.
It is important to note in the code that the ‘measureData()’ function is called before any of the values are displayed – this is because the measurement process is separate to the reading of the individual sensor outputs.
Now that you know how to setup and measure data with the BME688 sensor, this functionality can be combined with the other features of the board.
Coding Resources:
The list of resources in the table below have been put together to introduce you to all of the features of the board. It is best to work through them in the order that they are laid out in the table.
| Online Tutorials – Pico Smart Air Quality Board. |
|---|
| Using the BME688 Sensor. |
| Using OLED and RTC. |
| The Buzzer, Buttons & ZIP LEDs. |
| Data Logging. |
| Analogue Input & Output Control. |