If you are new to the Pico, and Python development, check out Raspberry Pi’s guide to get you started
Kitronik have also written a First Steps Tutorial to get you started using the Pico with the Thonny Editor.
Getting the Smart Air Quality Code
Kitronik have written a module to use with the Pico Smart Air Quality Board which is available, along with sample programs, in the Kitronik GitHub.
If the words “Clone the repo” mean nothing then check out our guide to git
If you are new to using modules with the Pico, there is a helpful guide providing practical examples and explanations on how to do so.
Clone or download the repository and then copy / save the PicoAirQuality.py file to your Pico.
Thonny Setup
Depending on your Thonny setup, you might not be able to see the list of files currently stored on the Pico. To set this up, just click on the ‘View’ drop-down menu from the top left toolbar and then select ‘Files’. There should now be a new window on the left side of the Thonny screen – the top section showing files on your computer, and the bottom section showing files on the Pico. This will be very helpful later in the tutorial for accessing the log files stored on the Pico.
Data Logging
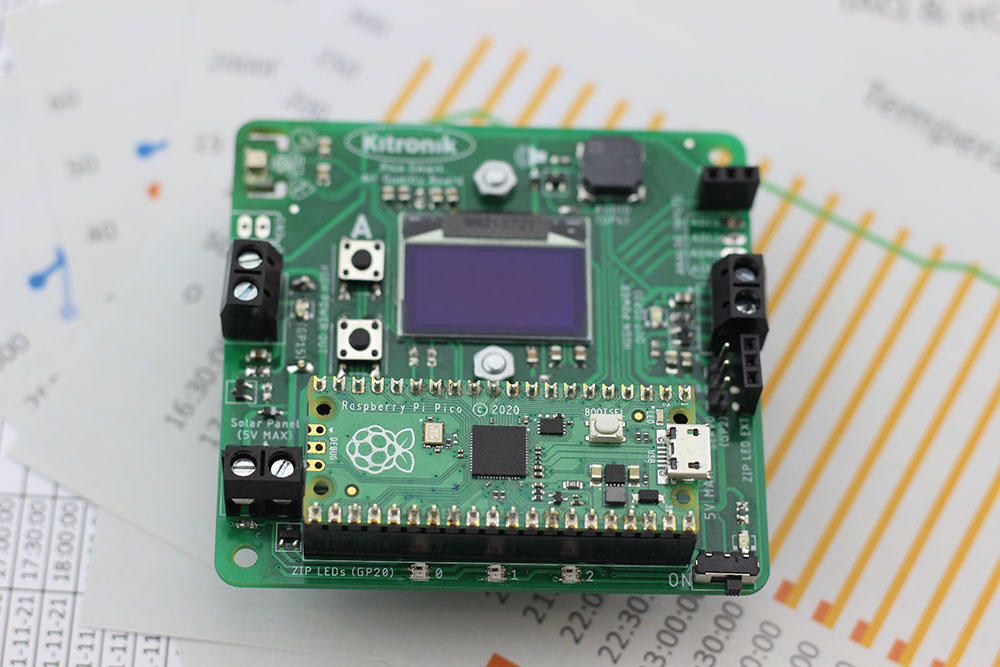
One of the main functions the Pico Smart Air Quality Board is designed for is data capture and logging. In previous tutorials we have already seen how to use the BME688 sensor) to take air quality and climate measurements, and how to set and read the time and date from the Pico RTC). In this tutorial we will be taking that information and saving it to a file on the Pico.
The Pico has 2MB of onboard flash memory, some of which used for storing the programs and modules being used, but the rest of the space is free to be accessed. Using MicroPython’s filesystem functionality, it is very easy to create, write to and read from files which are then stored on the Pico.
With the Pico correctly mounted on the board and connected to Thonny,
Create the following code and leave the program to run for a few minutes:
from PicoAirQuality import KitronikBME688, KitronikRTC, KitronikDataLogger
import time
bme688 = KitronikBME688()
rtc = KitronikRTC()
log = KitronikDataLogger("log.txt", "semicolon")
rtc.setDate(2, 11, 2021)
rtc.setTime(12, 0, 0)
while True:
    bme688.measureData()
    log.storeDataEntry(rtc.readDateString(), rtc.readTimeString(), str(bme688.readTemperature()), str(bme688.readPressure()), str(bme688.readHumidity()))
    time.sleep_ms(1000)
Once the program has had time to run for a few minutes, click the red ‘Stop’ button in Thonny (top left toolbar area).
Some of the code will be familiar from the first and second tutorials – creating instances of the BME688 and RTC, setting the date and time, and then measuring the data in the ‘while’ loop – but there are new sections for creating a data log and writing information to the file.
When the KitronikDataLogger class (‘log’) is initialised it can be passed a file name (in this example, “log.txt”) and also the separator between data fields. The separator is important for distinguishing between different measurements, otherwise there would just be a big string of letters and numbers in the log file. If no parameters are passed then the default filename of “data_log.txt”, and the default separator of “semicolon” are used of There are three different separator options available: “semicolon” (‘;’), “comma” (‘,’) and “tab” (‘ ‘). When the data files are imported into a spreadsheet program, such as Microsoft Excel, a ‘delimiter’ (the separator) can be selected, which then means that the data will be nicely formatted in rows and columns of individual data fields, making manipulation and analysis easier.
To actually save data to the log file, the ‘storeDataEntry()’ function is used, as can be seen in the ‘while’ loop in the code. This function can take up to ten different pieces of data, all of which must be in string format (the temperature, pressure and humidity measurements here have been converted using the ‘str()’ function to provide the correct format). Each time the ‘storeDataEntry()’ function is called, it creates a single string containing all of the data fields, divided up using the chosen separator, and then writes this to the log file. The function ensures that the maximum file size of 500kB (approximately 10000 full entries) is never exceeded, deleting the earliest data entries to make space for newer ones when the limit is reached.
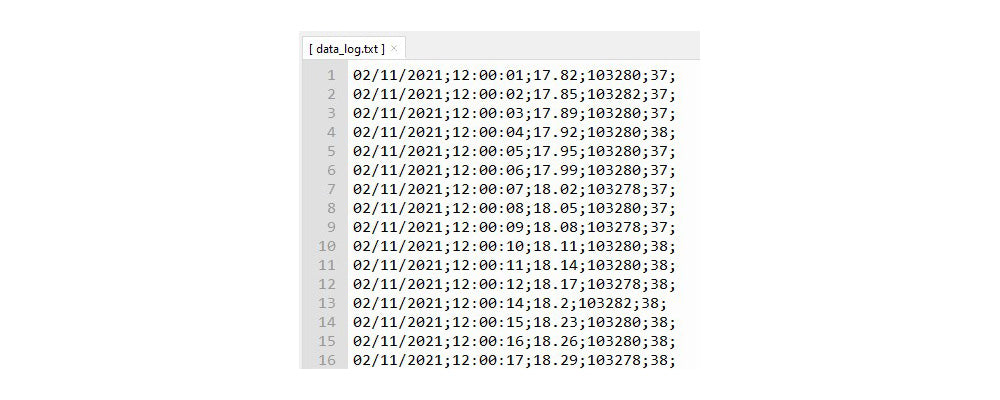
The ‘log.txt’ file just created in the program should be visible in the Pico Files window setup at the start of the tutorial; double click to open it and view the contents. The Pico was logging data once a second, so there should be lots of data entries, all with a date and time stamp and then temperature, pressure and humidity readings.
We have now successfully captured and logged data from the BME688 sensor, but at the moment, the file is a bit hard to read – it would be better if there were some data field headings and extra information. Handily, there are two other functions which make this possible.
Before starting the next section, close the log file and then left click on ‘log.txt’ in the ‘Files’ window and delete the file. If you do not do this then the logging data will append to the existing data
Add the following code in Thonny, just before the ‘while’ loop, and run for a few minutes:
log.writeProjectInfo("Environmental Data Log", "User Name", "Project A")

log.nameColumnHeadings("Date", "Time", "Temperature", "Pressure", "Humidity")
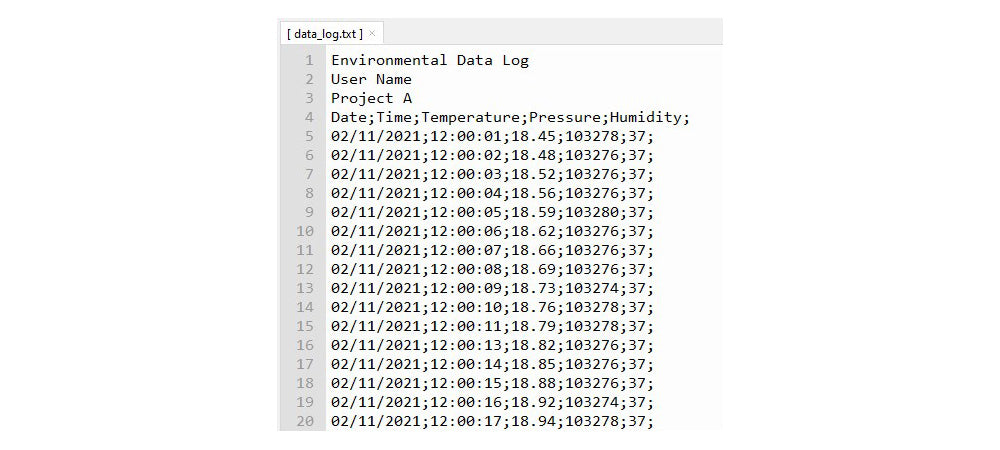
The ‘writeProjectInfo()’ function allows three pieces of information to be supplied and written to the log file – in this case, a title, name and subject area relevant to the logging project have been given. ‘nameColumnHeadings()’ adds headings for the data fields (these would become the column headings if the data was imported to a spreadsheet). Make sure to have the order of the headings and data entry fields match, otherwise the log file will be very confusing!
Once it has been running for a few minutes, stop the program and open the log file. If you deleted the previous file there should now be a collection of helpful information at the top, before all the data entries start. If you did not then the header information will be somewhere in the middle of the file.
In this example program, data has been logged constantly every second, but in real-life scenarios, it is likely that longer periods of time will need to pass between each measurement. In that case, using a ‘sleep’ in the code is very impractical, as it would stop any other functions running. Why not try using an alarm to trigger data logging instead?
Hint: This is an ideal use case for periodic alarms .
Coding Resources:
The list of resources in the table below have been put together to introduce you to all of the features of the board. It is best to work through them in the order that they are laid out in the table.
| Online Tutorials – Pico Smart Air Quality Board. |
|---|
| Using the BME688 Sensor. |
| Using OLED and RTC. |
| The Buzzer, Buttons & ZIP LEDs. |
| Data Logging. |
| Analogue Input & Output Control. |